
Et nyt værktøj fra Google er at teste og give dig anbefalingen om at forbedre ydeevne, SEO, sikkerhed, bedste praksis og tilgængelighed.
Google lancerede for nylig Fyrtårnet open source-værktøj til at revidere dit websted manuelt og automatisk.
Indholdsfortegnelse
Hvilke målinger testes af Google Lighthouse?
Der er mere end 75 målinger, den tester og giver dig en samlet score. Du kan være interesseret i nogle af følgende populære som webstedsejer, SEO-analytiker og webmaster.
- Ydeevne – tid til interaktiv, latens, hastighedsindeks, ressourceoptimering, TTFB, aktivlevering, scriptudførelsestid, DOM-størrelse osv.
- SEO – Mobilvenlig, meta, crawling, kanonisk, struktur osv.
- Bedste praksis – Billedoptimering, JS-biblioteker, browserfejllogning, tilgængelig via HTTPS, kendte JS-sårbarheder osv.
- Tilgængelighed – Sideelementer, sprog, ARIA-attributter osv.
- PWA (Progressive Web Application) – omdiriger HTTP til HTTPS, svarkode ok, hurtig indlæsning på 3G, splash screen, viewport osv.
Det er et fantastisk værktøj, og du kan bruge det på flere måder.
Det er rigtigt – så mange måder. Hvis du er udvikler, kan du bruge Node.js til at køre en test programmatisk. Der er allerede et par værktøjer på markedet drevet af Lighthouse, som tilbyder kontinuerlig overvågning af stedets ydeevne.
Lad os finde ud af, hvordan du kører fyrtårnstesten mod dit websted.
Start fra den nemmeste.
Mål ved web.dev
Google udgav web.dev for et par måneder siden og opnåede god popularitet. Det er nemt at teste online.
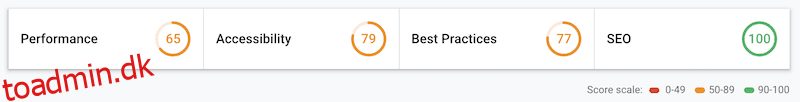
Gå til Måle side og indtast URL’en for at køre revisionen. Det vil tage et par sekunder, og du bør se den detaljerede rapportering med den samlede score.
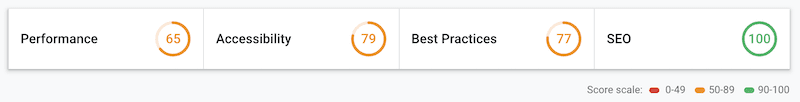
Resultaterne viser også succesmålingstesten for de beståede revisioner og arbejdet med disse behov.
Brug ikke for meget tid på at få 100. Selv Googles websteder scorer det ikke.
Betragt dem som retningslinjer og prøv at forbedre så meget, du kan.
Bemærk: web.dev emulerer en test ved hjælp af en mobilenhed, og mens jeg skriver, kan jeg ikke se en mulighed for at teste med Desktop.
Chrome
Ved du, at Lighthouse er tilgængelig i din Chrome-browser? Og den gode nyhed er, at du kan vælge at teste ved hjælp af mobil eller desktop, og det er tilgængeligt i udviklerværktøjer.
- Åbn Chrome-browseren
- Få adgang til dit websted for at teste
- Åbn udviklerværktøjer (tryk på F12, hvis du bruger Windows), eller højreklik på siden og klik på Inspicer.
- Gå til fanen revisioner.
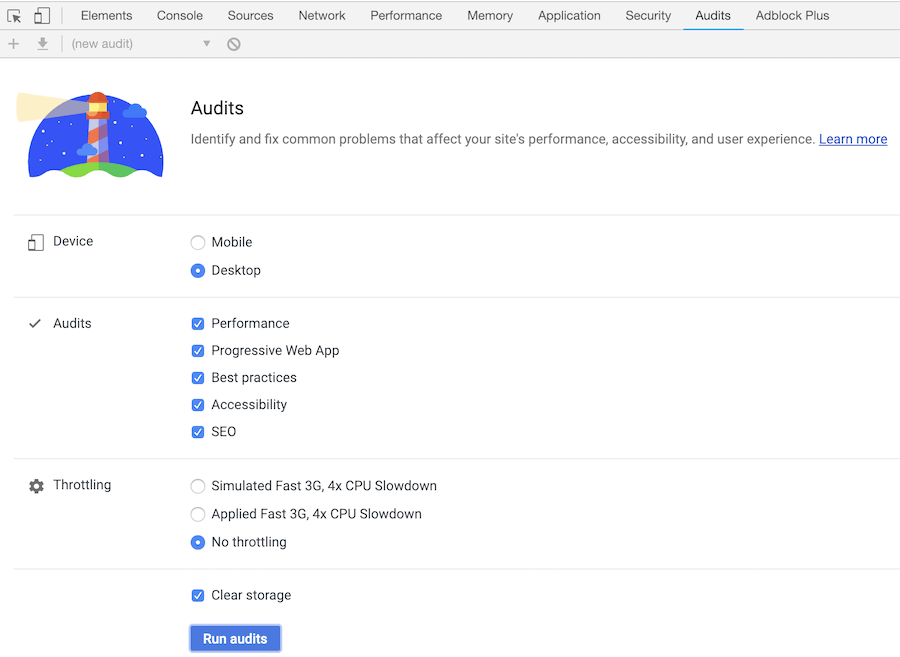
Som du kan se ovenfor, har du mulighed for at vælge, hvad du vil teste. Det er fantastisk at fokusere på dit mål og få revisionsresultaterne hurtigere.
Resultaternes udseende og fornemmelse fra Chome og web.dev er næsten ens.
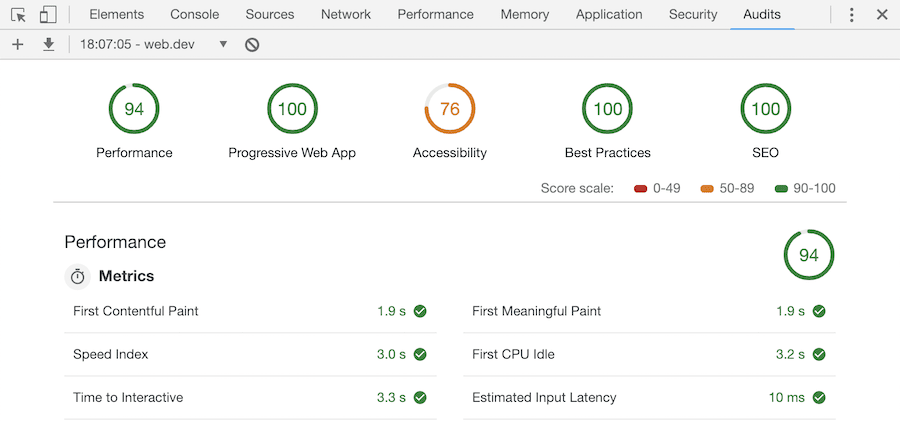
Men hvis du ser grundigt på det, er der en ekstra metrisk gruppe her – Progressive Web App. Så endnu en grund til at revidere ved hjælp af Chrome.
toadmin.dk Lighthouse API
Du kan også få web-ydeevnedata med toadmin.dk Lighthouse API. Dette udtrækker Lighthouse-metrics til mobil eller desktop med blot et klik i HTML-, JSON- eller CSV-format.
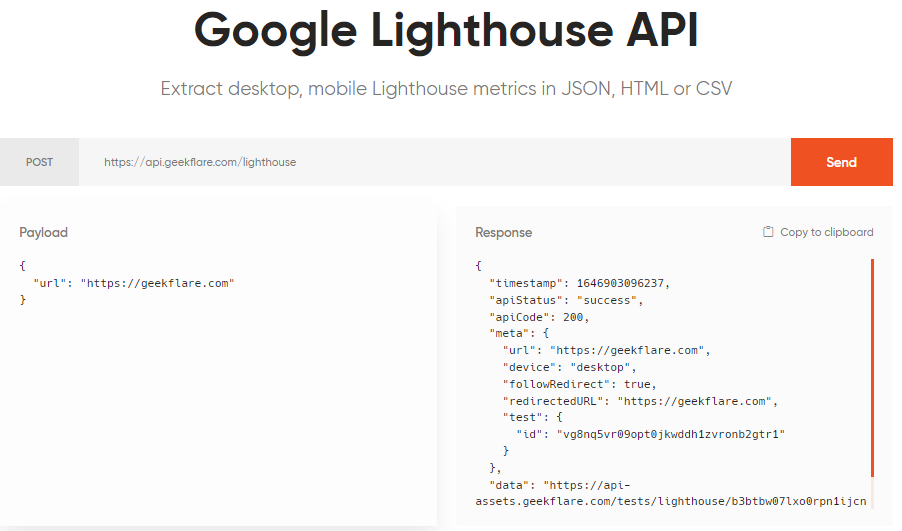
Du kan også tilpasse rapporten ved at ændre outputformatet og/eller fokusere på en bestemt metrik som SEO.
{
  "parameters": [
      "--output=html",
      "--only-categories=seo",
  ],
  "url": "example.com"
}
Og heldigvis har vi et gratis niveau uden bindinger, der kommer med 3000 API-kald om måneden. De betalte tilføjer dog support til flere steder, proxy for boliger og højere anmodningssatser, startende med kun $5 om måneden.
Node.js
Lighthouse er tilgængelig som et Node-modul. Du kan installere det på din server og bruge det programmatisk eller kommandolinje. Lad os hurtigt tjekke ud, hvordan man installerer Lighthouse for at køre nogle tests.
Installation af Lighthouse på Ubuntu 18.x
Følgende har jeg testet på DigitalOcean server. Lighthouse kræver Node LTS 8.9 eller nyere, og jeg antager, at du allerede har det installeret. Hvis ikke, se denne Node.js installationsvejledning.
Du skal også have en chromium-browser installeret på serveren. Jeg dækkede installationsvejledningen her.
Installation af Lighthouse er ligetil, ligesom du gør andre moduler.
- Log ind på din server
- Kør følgende kommando for at installere
npm install -g lighthouse
Jeg bruger -g her, så det bliver installeret som et globalt modul.
[email protected]:~# npm install -g lighthouse
/usr/bin/lighthouse -> /usr/lib/node_modules/lighthouse/lighthouse-cli/index.js
/usr/bin/chrome-debug -> /usr/lib/node_modules/lighthouse/lighthouse-core/scripts/manual-chrome-launcher.js

> [email protected] postinstall /usr/lib/node_modules/lighthouse/node_modules/axe-core
> node build/utils/postinstall.js

+ [email protected]
added 179 packages from 119 contributors in 10.094s
[email protected]:~#
Når det er installeret, skal du køre fyrtårnskommando for at sikre, at det er blevet installeret korrekt.
[email protected]:~# lighthouse
Please provide a url

Specify --help for available options
[email protected]:~#
Godt, fyrtårnet er klar til at køre revisionen. Lad os prøve nogle testmuligheder.
For at køre en test ved hjælp af en hovedløs browser
lighthouse URL --chrome-flags="--headless"
Du skal angive en absolut URL, inklusive HTTP eller HTTPS.
Eks:
[email protected]:~$ lighthouse https://toadmin.dk.com --chrome-flags="--headless"
  ChromeLauncher Waiting for browser. +0ms
  ChromeLauncher Waiting for browser... +1ms
  ChromeLauncher Waiting for browser..... +511ms
  ChromeLauncher Waiting for browser.....✓ +2ms
  status Connecting to browser +176ms
  status Resetting state with <a href="https://toadmin.dk.com/aboutblank-in-chrome-firefox-safari/">about:blank</a> +24ms
  status Benchmarking machine +30ms
  status Initializing… +508ms
  status Loading page & waiting for onload Scripts, CSSUsage, Viewport, ViewportDimensions, ThemeColor, Manifest, RuntimeExceptions, ChromeConsoleMessages, ImageUsage, Accessibility, LinkElements, AnchorsWithNoRelNoopener, AppCacheManifest, Doctype, DOMStats, JSLibraries, OptimizedImages, PasswordInputsWithPreventedPaste, ResponseCompression, TagsBlockingFirstPaint, MetaDescription, FontSize, CrawlableLinks, MetaRobots, Hreflang, EmbeddedContent, Canonical, RobotsTxt +27ms
  status Retrieving in-page: Scripts +2s
  status Retrieving in-page: CSSUsage +0ms
  status Retrieving in-page: Viewport +0ms
  status Retrieving in-page: ViewportDimensions +0ms
  status Retrieving in-page: ThemeColor +0ms
  status Retrieving in-page: Manifest +0ms
  status Retrieving in-page: RuntimeExceptions +0ms
  status Retrieving in-page: ChromeConsoleMessages +0ms
  status Retrieving in-page: ImageUsage +0ms
  status Retrieving in-page: Accessibility +0ms
  status Retrieving in-page: LinkElements +0ms
  status Retrieving in-page: AnchorsWithNoRelNoopener +1ms
  status Retrieving in-page: AppCacheManifest +0ms
  status Retrieving in-page: Doctype +0ms
  status Retrieving in-page: DOMStats +0ms
  status Retrieving in-page: JSLibraries +0ms
  status Retrieving in-page: OptimizedImages +0ms
  status Retrieving in-page: PasswordInputsWithPreventedPaste +0ms
  status Retrieving in-page: ResponseCompression +0ms
  status Retrieving in-page: TagsBlockingFirstPaint +0ms
  status Retrieving in-page: MetaDescription +0ms
  status Retrieving in-page: FontSize +0ms
  status Retrieving in-page: CrawlableLinks +0ms
  status Retrieving in-page: MetaRobots +0ms
  status Retrieving in-page: Hreflang +0ms
  status Retrieving in-page: EmbeddedContent +0ms
  status Retrieving in-page: Canonical +0ms
  status Retrieving in-page: RobotsTxt +0ms
  status Retrieving trace +1ms
  status Retrieving devtoolsLog & network records +110ms
  status Retrieving: Scripts +27ms
  status Retrieving: CSSUsage +53ms
  status Retrieving: Viewport +192ms
  status Retrieving: ViewportDimensions +5ms
  status Retrieving: ThemeColor +13ms
  status Retrieving: Manifest +2ms
  status Retrieving: RuntimeExceptions +295ms
  status Retrieving: ChromeConsoleMessages +1ms
  status Retrieving: ImageUsage +2ms
  status Retrieving: Accessibility +22ms
  status Retrieving: LinkElements +526ms
  status Retrieving: AnchorsWithNoRelNoopener +10ms
  status Retrieving: AppCacheManifest +6ms
  status Retrieving: Doctype +20ms
  status Retrieving: DOMStats +4ms
  status Retrieving: JSLibraries +50ms
  status Retrieving: OptimizedImages +25ms
  status Retrieving: PasswordInputsWithPreventedPaste +234ms
  status Retrieving: ResponseCompression +3ms
  status Retrieving: TagsBlockingFirstPaint +7ms
  status Retrieving: MetaDescription +6ms
  status Retrieving: FontSize +7ms
  status Retrieving: CrawlableLinks +245ms
  status Retrieving: MetaRobots +6ms
  status Retrieving: Hreflang +2ms
  status Retrieving: EmbeddedContent +2ms
  status Retrieving: Canonical +3ms
  status Retrieving: RobotsTxt +6ms
  status Resetting state with about:blank +19ms
  status Loading page & waiting for onload ServiceWorker, Offline, StartUrl +24ms
  status Retrieving in-page: ServiceWorker +59ms
  status Retrieving in-page: Offline +0ms
  status Retrieving in-page: StartUrl +1ms
  status Retrieving devtoolsLog & network records +0ms
  status Retrieving: ServiceWorker +2ms
  status Retrieving: Offline +1ms
  status Retrieving: StartUrl +1ms
  status Resetting state with about:blank +5ms
  status Loading page & waiting for onload HTTPRedirect, HTMLWithoutJavaScript +48ms
  status Retrieving in-page: HTTPRedirect +260ms
  status Retrieving in-page: HTMLWithoutJavaScript +0ms
  status Retrieving devtoolsLog & network records +0ms
  status Retrieving: HTTPRedirect +7ms
  status Retrieving: HTMLWithoutJavaScript +12ms
  status Disconnecting from browser... +7ms
  status Analyzing and running audits... +6ms
  status Evaluating: Uses HTTPS +3ms
  status Evaluating: Redirects HTTP traffic to HTTPS +24ms
  status Evaluating: Registers a service worker that controls page and start_url +1ms
  status Evaluating: Current page responds with a 200 when offline +0ms
  status Evaluating: Has a `<meta name="viewport">` tag with `width` or `initial-scale` +1ms
  status Evaluating: Contains some content when JavaScript is not available +1ms
  status Evaluating: First Contentful Paint +6ms
  status Evaluating: First Meaningful Paint +54ms
  status Evaluating: Page load is fast enough on mobile networks +10ms
  status Evaluating: Speed Index +33ms
  status Evaluating: Screenshot Thumbnails +529ms
  status Evaluating: Final Screenshot +287ms
  status Evaluating: Estimated Input Latency +2ms
  status Evaluating: No browser errors logged to the console +16ms
  status Evaluating: Server response times are low (TTFB) +1ms
  status Evaluating: First CPU Idle +1ms
  status Evaluating: Time to Interactive +30ms
  status Evaluating: User Timing marks and measures +0ms
  status Evaluating: Minimize Critical Requests Depth +2ms
  status Evaluating: Avoid multiple page redirects +3ms
  status Evaluating: Web app manifest meets the installability requirements +2ms
  status Evaluating: Configured for a custom splash screen +1ms
  status Evaluating: Sets an address-bar theme color +0ms
  status Evaluating: Content is sized correctly for the viewport +1ms
  status Evaluating: Displays images with correct aspect ratio +0ms
  status Evaluating: Avoids deprecated APIs +1ms
  status Evaluating: Minimizes main-thread work +0ms
  status Evaluating: JavaScript execution time +11ms
  status Evaluating: Preload key requests +3ms
  status Evaluating: Preconnect to required origins +2ms
  status Evaluating: All text remains visible during webfont loads +2ms
  status Evaluating: Network Requests +1ms
  status Evaluating: Metrics +2ms
  status Evaluating: start_url responds with a 200 when offline +1ms
  status Evaluating: Site works cross-browser +1ms
  status Evaluating: Page transitions don't feel like they block on the network +0ms
  status Evaluating: Each page has a URL +0ms
  status Evaluating: `[aria-*]` attributes match their roles +1ms
  status Evaluating: `[role]`s have all required `[aria-*]` attributes +1ms
  status Evaluating: Elements with `[role]` that require specific children `[role]`s, are present +0ms
  status Evaluating: `[role]`s are contained by their required parent element +1ms
  status Evaluating: `[role]` values are valid +1ms
  status Evaluating: `[aria-*]` attributes have valid values +0ms
  status Evaluating: `[aria-*]` attributes are valid and not misspelled +1ms
  status Evaluating: `<audio>` elements contain a `<track>` element with `[kind="captions"]` +1ms
  status Evaluating: Buttons have an accessible name +1ms
  status Evaluating: The page contains a heading, skip link, or landmark region +1ms
  status Evaluating: Background and foreground colors have a sufficient contrast ratio +1ms
  status Evaluating: `<dl>`'s contain only properly-ordered `<dt>` and `<dd>` groups, `<script>` or `<template>` elements. +1ms
  status Evaluating: Definition list items are wrapped in `<dl>` elements +0ms
  status Evaluating: Document has a `<title>` element +1ms
  status Evaluating: `[id]` attributes on the page are unique +1ms
  status Evaluating: `<frame>` or `<iframe>` elements have a title +1ms
  status Evaluating: `<html>` element has a `[lang]` attribute +0ms
  status Evaluating: `<html>` element has a valid value for its `[lang]` attribute +1ms
  status Evaluating: Image elements have `[alt]` attributes +1ms
  status Evaluating: `<input type="image">` elements have `[alt]` text +1ms
  status Evaluating: Form elements have associated labels +0ms
  status Evaluating: Presentational `<table>` elements avoid using `<th>`, `<caption>` or the `[summary]` attribute. +1ms
  status Evaluating: Links have a discernible name +1ms
  status Evaluating: Lists contain only `<li>` elements and script supporting elements (`<script>` and `<template>`). +1ms
  status Evaluating: List items (`<li>`) are contained within `<ul>` or `<ol>` parent elements +1ms
  status Evaluating: The document does not use `<meta http-equiv="refresh">` +0ms
  status Evaluating: `[user-scalable="no"]` is not used in the `<meta name="viewport">` element and the `[maximum-scale]` attribute is not less than 5. +1ms
  status Evaluating: `<object>` elements have `[alt]` text +1ms
  status Evaluating: No element has a `[tabindex]` value greater than 0 +1ms
  status Evaluating: Cells in a `<table>` element that use the `[headers]` attribute only refer to other cells of that same table. +1ms
  status Evaluating: `<th>` elements and elements with `[role="columnheader"/"rowheader"]` have data cells they describe. +0ms
  status Evaluating: `[lang]` attributes have a valid value +1ms
  status Evaluating: `<video>` elements contain a `<track>` element with `[kind="captions"]` +1ms
  status Evaluating: `<video>` elements contain a `<track>` element with `[kind="description"]` +1ms
  status Evaluating: `[accesskey]` values are unique +1ms
  status Evaluating: Custom controls have associated labels +0ms
  status Evaluating: Custom controls have ARIA roles +1ms
  status Evaluating: User focus is not accidentally trapped in a region +0ms
  status Evaluating: Interactive controls are keyboard focusable +0ms
  status Evaluating: Headings don't skip levels +0ms
  status Evaluating: Interactive elements indicate their purpose and state +1ms
  status Evaluating: The page has a logical tab order +0ms
  status Evaluating: The user's focus is directed to new content added to the page +1ms
  status Evaluating: Offscreen content is hidden from assistive technology +0ms
  status Evaluating: HTML5 landmark elements are used to improve navigation +0ms
  status Evaluating: Visual order on the page follows DOM order +0ms
  status Evaluating: Uses efficient cache policy on static assets +1ms
  status Evaluating: Avoids enormous network payloads +3ms
  status Evaluating: Defer offscreen images +1ms
  status Evaluating: Eliminate render-blocking resources +12ms
  status Evaluating: Minify CSS +28ms
  status Evaluating: Minify JavaScript +64ms
  status Evaluating: Defer unused CSS +69ms
  status Evaluating: Serve images in next-gen formats +12ms
  status Evaluating: Efficiently encode images +11ms
  status Evaluating: Enable text compression +6ms
  status Evaluating: Properly size images +6ms
  status Evaluating: Use video formats for animated content +7ms
  status Evaluating: Avoids Application Cache +11ms
  status Evaluating: Page has the HTML doctype +0ms
  status Evaluating: Avoids an excessive DOM size +1ms
  status Evaluating: Links to cross-origin destinations are safe +2ms
  status Evaluating: Avoids requesting the geolocation permission on page load +1ms
  status Evaluating: Avoids `document.write()` +0ms
  status Evaluating: Avoids front-end JavaScript libraries with known security vulnerabilities +0ms
  status Evaluating: Detected JavaScript libraries +9ms
  status Evaluating: Avoids requesting the notification permission on page load +1ms
  status Evaluating: Allows users to paste into password fields +0ms
  status Evaluating: Uses HTTP/2 for its own resources +0ms
  status Evaluating: Uses passive listeners to improve scrolling performance +1ms
  status Evaluating: Document has a meta description +0ms
  status Evaluating: Page has successful HTTP status code +1ms
  status Evaluating: Document uses legible font sizes +5ms
  status Evaluating: Links have descriptive text +1ms
  status Evaluating: Page isn’t blocked from indexing +1ms
  status Evaluating: robots.txt is valid +2ms
  status Evaluating: Document has a valid `hreflang` +1ms
  status Evaluating: Document avoids plugins +1ms
  status Evaluating: Document has a valid `rel=canonical` +0ms
  status Evaluating: Page is mobile friendly +1ms
  status Evaluating: Structured data is valid +0ms
  status Generating results... +0ms
  ChromeLauncher Killing Chrome instance 7098 +59ms
  Printer html output written to /home/chandan/toadmin.dk.com_2019-01-20_19-29-35.report.html +46ms
  CLI Protip: Run lighthouse with `--view` to immediately open the HTML report in your browser +1ms
I den næstsidste linje kan du se, at den har udskrevet stien til at finde rapporten. Som standard vil den generere en rapport i HTML-format, som du kan se enten ved at downloade på din pc eller servere den via en webserver.
Men hvad nu hvis du skal generere en rapport i JSON-format?
Det kan lade sig gøre som følgende.
lighthouse URL --chrome-flags="--headless" --output json --output-path URL.json
Ved at bruge Lighthouse CLI har du fuld kontrol over at bruge det, som du ønsker det. Jeg vil stærkt anbefale at tjekke ud GitHub-depot for at lære mere om brug af CLI eller programmatisk.
Konklusion
Google Lighthouse ligner et lovende værktøj til at udføre en kontinuitetstest for at forbedre webstedets ydeevne og brugervenlighed. Hvis du bruger WordPress og ønsker at få dit websted til at indlæse hurtigere, så tjek det ud Raket.